Beer Infographic Design Template: Visual Brewing Data
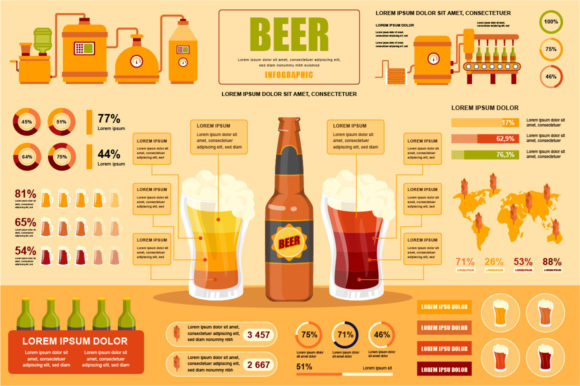
Craft beer is as much about the story of production as it is about the final pour. For designers, marketers, and brewery owners, translating complex brewing processes into digestible visual content is a constant challenge. The Beer Infographic Design Template bridges this gap by offering a structured yet flexible framework for communicating technical information. This vector-based resource combines aesthetic appeal with functional data visualization, allowing creators to present workflows, timelines, and ingredient breakdowns without starting from scratch. It serves as a foundational tool for anyone needing to explain the art and science of fermentation to an audience that values both accuracy and design.
Deconstructing the Vector Assets and File Formats
The utility of any design asset lies in its adaptability. This template package is engineered for professional versatility, providing six distinct file formats to cover every stage of the creative workflow. The inclusion of EPS10 and AI files ensures full editability within Adobe Illustrator, allowing for deep customization of nodes, colors, and typography. These vector formats are resolution-independent, meaning the graphics remain crisp whether printed on a massive brewery wall mural or scaled down for a mobile app interface.
For users who require quick deployment or lack advanced vector software, the PDF, JPG, PNG, and SVG files offer immediate accessibility. The SVG format is particularly valuable for web designers integrating interactive elements into brewery websites, while the high-resolution PNG supports transparent backgrounds for layering over photography. This multi-format approach acknowledges that modern design teams operate across various platforms and skill levels. Whether you are a freelance illustrator refining a client’s brand identity or a small business owner creating social media content, the ZIP archive contains the specific tool needed for your current environment.
Visualizing Production Workflows and Timelines
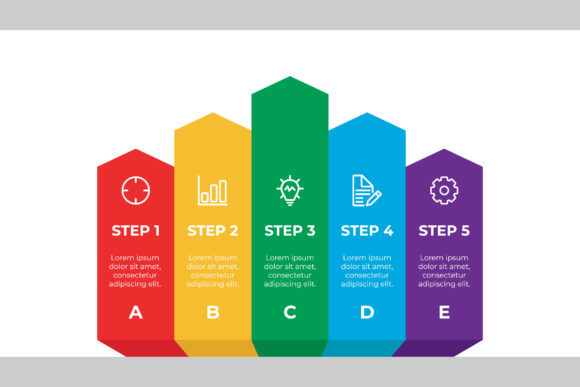
Brewing is a linear process with cyclical nuances, making it ideal for timeline-based infographics. The template provides pre-arranged layouts specifically designed to map out the journey from grain to glass. Instead of listing steps in dense paragraphs, designers can utilize graphic data visualization to show the progression through mashing, lautering, boiling, fermenting, conditioning, and packaging. This visual sequencing helps demystify the production cycle for consumers who are curious about what distinguishes a lager from an ale or why sour beers require extended aging.
Educators and tour guides find particular value in these workflow diagrams. When explaining the difference between top-fermenting and bottom-fermenting yeasts, a spatial representation clarifies temperature and time variables more effectively than verbal explanation alone. The template’s modular nature allows users to expand or contract the timeline based on the specific beverage being featured. A simple pale ale might require four distinct stages, while a barrel-aged stout could necessitate a complex branching diagram showing blending ratios and maturation periods. By adapting the underlying structure, the infographic remains factually accurate regardless of the recipe's complexity.
Strategic Applications Across Different Audiences
The strength of the Beer Infographic Design Template emerges when applied to specific user goals. Different stakeholders in the beverage industry have unique communication needs, and this asset adapts to serve them all.
- Brewery Marketing Teams: Use the poster templates to create point-of-sale materials that highlight unique selling propositions. Visualizing water chemistry profiles or hop addition schedules can differentiate a technically superior product in a crowded taproom market.
- Homebrew Educators: Simplify complex chemical reactions for beginners. The editable text fields allow instructors to replace industry jargon with accessible language, creating handouts that reduce intimidation for new hobbyists.
- Food and Beverage Bloggers: Enhance long-form articles with custom graphics. Rather than using generic stock photos, bloggers can insert tailored infographics that break down tasting notes or pairing suggestions, increasing dwell time and shareability.
- Packaging Designers: Utilize the vector elements as secondary graphics on cans and labels. The scalable icons and charts can reinforce brand storytelling directly on the shelf where purchasing decisions occur.
Maintaining Clarity Through Data Hierarchy
Having a beautiful template does not guarantee effective communication. The most successful adaptations prioritize information hierarchy over decorative excess. When customizing the Beer Infographic Design Template, start by identifying the single most important takeaway for the viewer. Is it the alcohol by volume? The origin of the hops? The sustainability of the water source? Anchor the design around this primary metric and use secondary visual elements to support rather than compete with it.
Consistency in visual language builds trust. If you choose a flat illustration style for your icons, maintain that aesthetic throughout the entire composition. Mixing photorealistic elements with geometric vectors often creates cognitive dissonance. Similarly, limit your color palette to three or four core tones derived from the brand identity or the liquid itself. Over-saturating an infographic with rainbow gradients distracts from the data. Effective use of white space is equally critical; breathing room between workflow steps allows the eye to rest and process information sequentially. Remember that the goal is comprehension, not just decoration.
Creative Variations and Stylistic Approaches
While the template provides a solid baseline, true creativity emerges through interpretation. Consider adapting the visual style to match the specific genre of beer being showcased. A clean, minimalist line-art approach suits modern pilsners and lagers, reflecting their crisp and refined character. Conversely, a textured, hand-drawn aesthetic with organic shapes might better represent farmhouse ales or traditional Belgian styles. The vector nature of the assets means lines can be roughened, smoothed, or distorted to achieve these varied moods without losing structural integrity.
Data visualization need not be limited to standard bar charts or pie graphs. Explore metaphorical representations that resonate with beer culture. Fermentation activity could be shown through rising bubble clusters of varying sizes. Temperature control might be represented by a gradient thermometer integrated into the mash tun illustration. Ingredient sourcing maps can replace generic location pins with stylized agricultural icons. These thematic choices transform dry statistics into engaging narratives. However, always test these creative interpretations with a sample audience to ensure the metaphor translates clearly. Innovation should enhance understanding, not obscure it.
Practical Tips for Editable Text and Customization
The editable text feature is perhaps the most practical aspect of this template, but it requires thoughtful handling. Typography carries tone. A bold sans-serif font communicates modernity and confidence, suitable for IPAs and experimental brews. Traditional serifs or slab serifs evoke heritage and craftsmanship, aligning well with stouts and porters. When replacing placeholder text, pay close attention to kerning and leading. Auto-adjusted text boxes sometimes compress characters awkwardly; manual refinement ensures professional polish.
Consider localization if your audience spans multiple regions. Beer terminology varies significantly between countries. What is called "gravity" in one region might be referred to as "density" in another. The flexibility of the AI and EPS files allows for easy swapping of terms without disrupting the layout. Additionally, ensure all measurements are appropriate for the target market, converting between imperial and metric systems as necessary. Accuracy in these details demonstrates respect for the audience and reinforces the credibility of the presentation.
Ultimately, the Beer Infographic Design Template is a catalyst for clearer communication. It removes the friction of building complex layouts from zero, freeing designers to focus on narrative and accuracy. By balancing technical precision with creative expression, this resource empowers creators to elevate how alcoholic beverages are understood and appreciated. Whether used for education, marketing, or artistic exploration, the template proves that data and design can coexist beautifully in the world of craft brewing.