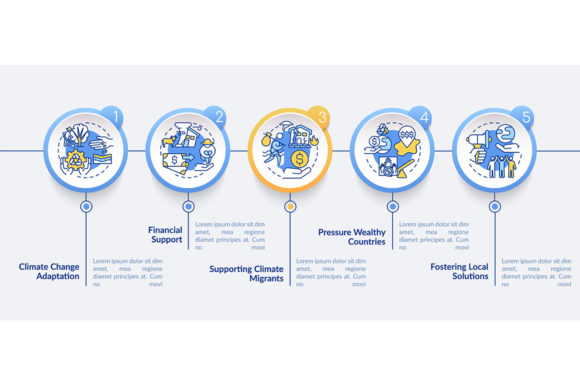
Visualizing Resilience with a Climate Change Adaptation Infographic
Communicating the complexities of environmental resilience requires more than just raw data; it demands a narrative structure that guides stakeholders from vulnerability to action. A Climate Change Adaptation Infographic serves as this critical bridge, transforming dense scientific reports and policy frameworks into accessible, actionable visual stories. Unlike general awareness graphics that focus on the problem, adaptation visuals specifically target solutions, workflows, and implementation strategies. When utilizing a professional vector template designed for this purpose, the goal is to reduce cognitive load while maintaining the gravity and precision required for environmental justice presentations and municipal planning.
Translating Policy into Community Action
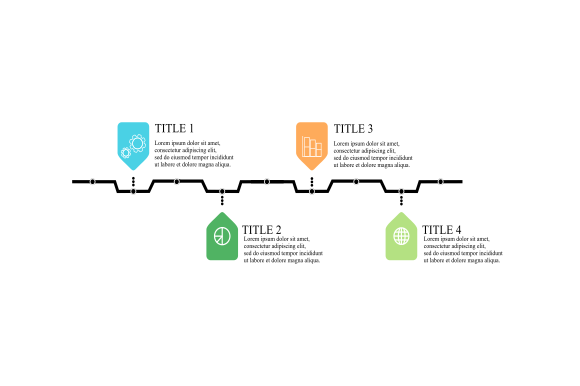
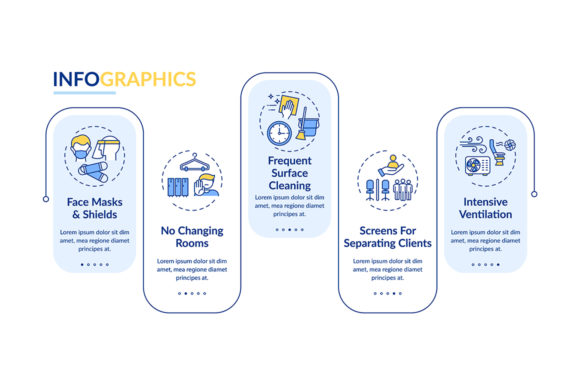
One of the most immediate applications for these visual tools is within local government and community outreach. Municipal planners often struggle to convey long-term infrastructure projects to residents who are concerned about immediate impacts like flooding or heat islands. A linear workflow layout breaks down abstract adaptation plans into tangible phases. For example, a city council presenting a new urban canopy strategy can use a five-step process timeline chart to illustrate the progression from "Vulnerability Assessment" to "Community Feedback," "Pilot Implementation," "Monitoring," and finally "Full Scale Integration."
This approach is particularly vital when addressing environmental justice. Communities disproportionately affected by climate change need to see exactly where they fit into the adaptation process. Using clean, inclusive design elements helps demystify bureaucratic language. When residents can visually track the workflow, trust increases. The infographic becomes a transparency tool, showing not just what will be done, but how community input directly influences specific stages of the project. In this context, the vector template isn't just decoration; it is an instrument of civic engagement and equity.
Corporate Sustainability and ESG Reporting
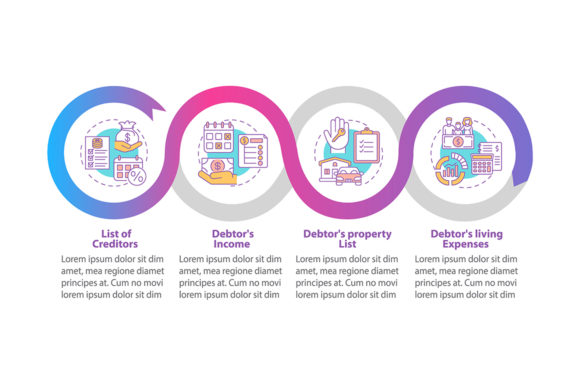
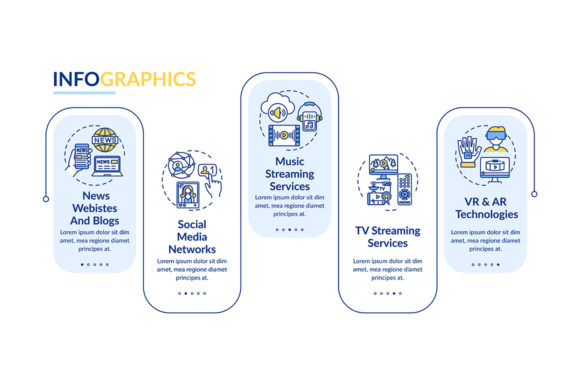
In the private sector, the stakes for climate communication are equally high but driven by different metrics. Investors and consumers are increasingly scrutinizing Environmental, Social, and Governance (ESG) criteria. A generic sustainability graphic no longer suffices; stakeholders want to see specific adaptation mechanisms. Supply chain managers can leverage these infographics to map out resilience against climate disruptions. Imagine a logistics company explaining how they are adapting their distribution network to extreme weather events. A data visualization with five distinct steps can clearly outline their risk mitigation protocol: identifying choke points, diversifying suppliers, upgrading facility hardening, establishing emergency response teams, and conducting annual stress tests.
Here, the utility of having editable source files like AI or EPS becomes apparent. Corporate branding guidelines are strict, and off-the-shelf graphics rarely align perfectly with a company’s visual identity. Being able to modify the linear icons and color palettes ensures that the adaptation strategy feels integrated into the broader business narrative rather than tacked on as an afterthought. This seamless integration signals to investors that climate adaptation is core to the business model, not merely a compliance exercise.
Educational Contexts and Capacity Building
Non-profits and educational institutions face the unique challenge of teaching adaptation concepts to diverse audiences ranging from students to industry professionals. Text-heavy manuals often fail to retain attention during workshops or training sessions. A well-structured process timeline chart acts as a pedagogical anchor. When training farmers on drought-resistant agricultural practices, for instance, trainers can use the infographic to visualize the seasonal cycle of adaptation measures. Each step in the workflow can correspond to a module in the curriculum, helping learners mentally organize complex information.
The versatility of file formats in these templates supports this educational flexibility. High-resolution JPG and PNG files are perfect for printed handouts or slide decks, while SVG versions ensure crisp rendering on interactive web platforms or mobile learning apps. This multi-format availability allows educators to maintain visual consistency across different mediums, reinforcing learning through repetition and clear design cues. The linear icon style commonly found in these templates is especially effective here because it avoids cultural bias and focuses on universal functional symbolism, making the content more accessible to international or multilingual audiences.
Strategic Considerations Before Implementation
While a climate change adaptation vector infographic template provides a robust starting point, successful application requires thoughtful customization. The primary consideration should always be audience literacy. A technical engineering team might appreciate detailed data visualization with granular metrics, whereas a town hall meeting requires simplified, emotive iconography. Before opening the AI or EPS file, define the specific knowledge gap you are trying to close. Are you explaining why adaptation is necessary, or how it will be executed? These templates excel at the latter, so ensure your content strategy aligns with the workflow-centric nature of the design.
Data integrity is another non-negotiable factor. Templates provide the container, but the accuracy of the content determines the credibility of the message. When populating the five-step process or timeline charts, verify that the sequence reflects current scientific consensus and local regulatory realities. Misrepresenting an adaptation pathway through oversimplification can lead to maladaptation or public backlash. It is often helpful to have a subject matter expert review the flow of the infographic before finalizing the design. The visual hierarchy should emphasize the most critical actions, ensuring that even if a viewer only scans the graphic for ten seconds, they understand the primary intervention strategy.
Navigating Design Limitations and Strengths
It is important to recognize both the power and the boundaries of these visual tools. Linear workflow layouts are excellent for depicting sequential processes, but climate systems are inherently non-linear and interconnected. Relying solely on a straight-line timeline might inadvertently suggest that adaptation has a definitive end point. To mitigate this, use the template as a foundation but consider adding feedback loops or cyclical elements where appropriate. The vector nature of the files allows for this kind of structural modification. You can bend the linear path into a circle or add connecting lines between steps to represent iterative learning and continuous improvement.
Another strength lies in the standardization these templates offer. For organizations managing multiple adaptation projects across different regions, using a consistent visual framework creates a cohesive portfolio. Stakeholders begin to recognize the visual language, making subsequent communications faster to digest. However, this standardization must be balanced with local context. An icon representing "water management" might look different in a coastal region compared to an arid inland area. Utilizing the editable vector components allows designers to swap generic symbols for culturally and geographically relevant imagery without rebuilding the entire layout from scratch.
Technical Flexibility for Diverse Workflows
The practical value of a ZIP file containing EPS, JPG, PNG, SVG, and AI formats extends beyond simple convenience; it future-proofs your communication assets. Vector formats like EPS and AI are essential for large-scale printing, such as exhibition banners at climate conferences or permanent signage in restored wetlands. They allow for infinite scaling without pixelation, ensuring that fine details in the data visualization remain sharp. Conversely, SVG files are lightweight and code-friendly, making them ideal for embedding directly into digital annual reports or responsive websites where load times matter.
For quick internal communications or email updates, the pre-rendered JPG and PNG options save time without sacrificing quality. This range of outputs supports agile workflows where the same core message needs to be deployed across print, web, social media, and presentation software simultaneously. When selecting a template, prioritize those that organize these layers logically. Well-structured AI files with named layers and grouped elements significantly reduce the time spent preparing the graphic for publication. In fast-moving environmental sectors where conditions and policies evolve rapidly, this efficiency translates directly into more timely and relevant communication.
Ultimately, the effectiveness of a Climate Change Adaptation Infographic lies in its ability to make the invisible visible. Whether securing funding for resilient infrastructure, educating the next generation of environmental stewards, or reporting progress to shareholders, these visual frameworks turn abstract challenges into manageable, understandable processes. By leveraging high-quality vector templates with intention and accuracy, communicators can move beyond raising awareness to actively facilitating the transition toward a more resilient future. The right design doesn't just display information; it organizes thought, aligns stakeholders, and accelerates the pace of adaptation itself.