Evaluating the Circle Flip Infographic for Modern Visual Communication
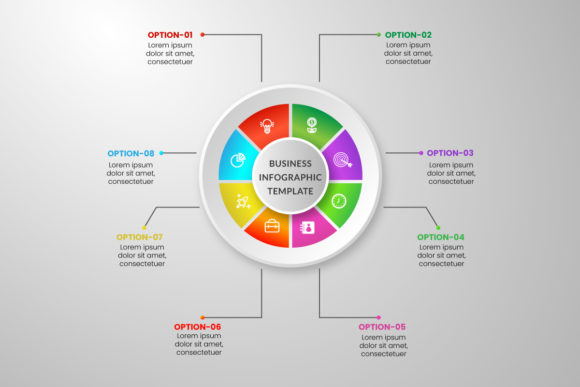
Visualizing cyclical data or sequential processes often presents a unique design challenge. Standard linear timelines fail to capture the repetitive nature of workflows, while generic pie charts lack the narrative capacity required for complex presentations. The Circle Flip Infographic addresses this specific gap by combining rotational symmetry with dynamic motion cues. This template is engineered for professionals who need to convey continuity, evolution, or iterative cycles without resorting to cluttered diagrams. When evaluating this resource against other infographic styles, it is essential to understand its technical specifications, aesthetic limitations, and optimal use cases to determine if it aligns with your current project requirements.
Technical Specifications and Workflow Integration
Before assessing the visual merits of the Circle Flip Infographic, practical compatibility must be established. This asset is built specifically for Adobe Illustrator CC 2020 and later versions. Users operating on older legacy software or alternative vector platforms may encounter compatibility issues with gradient meshes or opacity masks used in the flip effects. The file structure includes two EPS files and one JPEG preview, ensuring flexibility across different stages of production. The artboard is set to 1200 x 800 pixels, a landscape dimension optimized for widescreen presentations, LinkedIn carousels, and web headers rather than vertical social media stories or A4 print documents.
A critical distinction for designers is the color mode. This template utilizes RGB color space at 300 DPI resolution. While 300 DPI is traditionally associated with print, the RGB profile indicates a digital-first optimization. This provides vibrant luminosity for screens but requires color conversion management if the final output is intended for offset printing. Comparing this to CMYK-native templates, the Circle Flip Infographic offers superior screen presence but demands an extra step for physical collateral. The inclusion of the Poppins font family ensures typographic consistency, though users should verify licensing if they do not already have this typeface installed.
Editability Versus Structural Rigidity
The primary value proposition of this template is its customizable nature, but "editable" means different things across various design assets. In the context of the Circle Flip Infographic, editability refers to fully vector-based construction. Unlike rasterized mockups where text is baked into pixels, every curve, shadow, and label here remains mathematically defined. This allows for infinite scaling without degradation. However, compared to drag-and-drop web tools like Canva or PowerPoint SmartArt, the learning curve is steeper. Modifying the "flip" segments requires understanding path manipulation and layer hierarchy within Illustrator.
For teams with dedicated designers, this structural integrity is a benefit; it prevents accidental misalignment and maintains brand standards. For solo entrepreneurs or marketers without vector training, this rigidity can become a bottleneck. If your workflow requires rapid, daily updates to data points, a simpler table-based graphic might offer better efficiency. The Circle Flip Infographic is best suited for evergreen content or high-stakes presentations where visual polish outweighs the time investment required for customization.
Comparative Analysis: Circular Dynamics vs. Alternatives
When selecting a visualization method, it is helpful to compare the Circle Flip Infographic against three common alternatives: standard cycle diagrams, linear process flows, and dashboard widgets.
- Standard Cycle Diagrams: Traditional circular arrows are static and often perceived as dated. They indicate repetition but lack depth. The Circle Flip variant introduces a pseudo-3D element that suggests progression and modernity. It transforms a flat loop into a dynamic mechanism, making it more engaging for audiences accustomed to high-fidelity UI design.
- Linear Process Flows: Left-to-right timelines excel at showing history or step-by-step instructions with a clear beginning and end. However, they fail when representing feedback loops, seasonal trends, or continuous improvement methodologies like Kaizen. If your data has no true endpoint, forcing it into a linear format creates a false narrative. The circular format of this template accurately represents non-linear systems.
- Data Dashboard Widgets: Automated charting tools prioritize accuracy over aesthetics. They are ideal for real-time monitoring but often lack the storytelling capability needed for pitch decks or educational content. The Circle Flip Infographic sacrifices granular data precision for conceptual clarity, making it a strategic communication tool rather than an analytical instrument.
Aesthetic Fit and Brand Alignment
Design choices signal organizational culture. The modern creative design language of this template features clean lines, subtle gradients, and ample negative space. This aesthetic aligns well with technology firms, SaaS platforms, creative agencies, and forward-thinking consultancies. It communicates innovation and sophistication. Conversely, organizations in highly traditional sectors such as heavy manufacturing, legal services, or government administration may find the stylized "flip" effect too informal or distracting. In those contexts, a flatter, more conservative diagram might convey greater authority.
Furthermore, the RGB color palette influences emotional response. Bright, saturated digital colors attract attention in crowded feeds but can cause fatigue in long-form reading materials. When comparing this to muted, corporate-blue templates, the Circle Flip Infographic wins on engagement metrics but requires careful consideration regarding accessibility and contrast ratios for text legibility.
Decision Factors: Strengths and Tradeoffs
Making an informed decision requires weighing specific advantages against inherent limitations. No single template serves every purpose perfectly.
Where This Template Excels
- Conceptualizing Iteration: Perfect for product development lifecycles, agile sprints, recycling processes, or customer journey maps where the end state feeds back into the beginning.
- Digital Presentations: The 1200x800 aspect ratio and RGB optimization make it native to slide decks and video content, avoiding the pixelation issues common when repurposing print assets for screens.
- Brand Differentiation: The unique geometry helps break the monotony of bullet-point-heavy slides, providing a visual anchor that aids information retention.
- Scalable Vector Output: Future-proofing your asset library means you can resize this graphic for a billboard or a favicon without recreating it from scratch.
Potential Limitations to Consider
- Text Density Constraints: Curved segments inherently limit character counts. If your process steps require detailed explanations or multiple sub-points, this format will feel cramped. Text-heavy content is better served by card-based layouts or accordion designs.
- Software Dependency: Requires Adobe Illustrator CC 2020+. Organizations standardized on CorelDRAW, Affinity Designer, or Figma will face import friction or loss of editable features.
- Print Color Management: As noted, the RGB foundation necessitates manual proofing for print projects to avoid unexpected color shifts in cyan and magenta ranges.
- Cognitive Load: While visually striking, complex 3D-style infographics can sometimes obscure simple messages. If the goal is instant comprehension of basic data, simplicity often outperforms stylistic flair.
Practical Implementation Guidelines
To maximize the utility of the Circle Flip Infographic, approach customization strategically. Begin by auditing your content volume. Map your text to the template segments before applying styling changes; this reveals whether the format supports your message. Utilize the included help guide not just for technical instructions, but to understand the layer naming conventions, which streamlines future edits.
When adapting the color scheme, maintain sufficient contrast between the flip segments and the background. The modern creative design relies on subtle shading to create depth; altering colors blindly can flatten the image or reduce readability. Test your customized version at actual viewing size—what looks distinct on a 27-inch monitor may blur together when projected in a conference room or viewed on a mobile device.
Finally, consider the longevity of the asset. Because this template uses a specific version of Illustrator (CC 2020), save a master copy in that native format alongside exported PDFs or SVGs. This ensures that even as software updates change rendering engines, your core editable source remains accessible. By treating this infographic as a modular component of your broader design system rather than a disposable one-off, you extend its ROI significantly.
Making the Final Selection
The Circle Flip Infographic represents a specialized solution for digital-first communicators who value aesthetic precision and cyclical storytelling. It is not a universal replacement for all data visualization needs, nor is it the fastest option for quick internal memos. Its strength lies in bridging the gap between raw information and compelling visual narrative for external-facing or high-value internal audiences. If your priority is conveying movement, continuity, and modern professionalism within a digital ecosystem, this template warrants serious consideration. If your needs lean toward dense textual explanation, print-only deliverables, or non-vector workflows, exploring alternative formats will likely yield better results with less friction.