Presentation Infographic Template: A Practical Asset for Visual Communication
A Presentation Infographic Template is more than just a collection of pretty shapes; it is a structured visual framework designed to translate complex data into digestible narratives. For professionals and creators, this asset serves as a bridge between raw information and audience understanding. Unlike a standard slide deck that relies heavily on bullet points, an infographic template forces you to distill your message into key metrics, timelines, or process flows. When you download a package containing Vector AI CS3 files, EPS10 outlines, editable PSDs, and JPG previews, you are acquiring a versatile toolkit that adapts to various software environments and skill levels.
When Visual Structure Saves the Meeting
The most immediate application of a presentation infographic template occurs in high-stakes professional environments where attention spans are short. Consider a quarterly business review where stakeholders are fatigued by dense spreadsheets. Using a pre-designed timeline or funnel chart allows a project manager to visualize progress milestones rather than reading them aloud. The editable text layers in the Photoshop PSD file make this efficient; you can swap out Q1 projections for Q3 actuals in minutes without rebuilding the graphic from scratch.
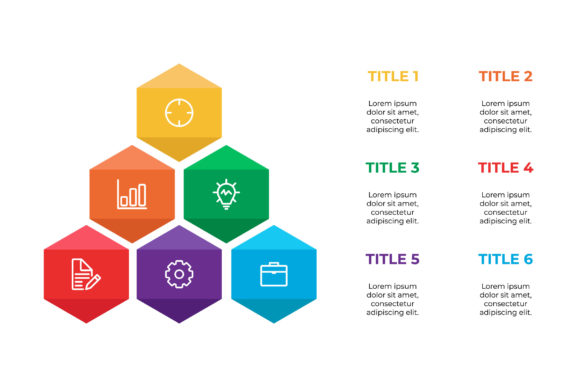
This utility extends to client pitches for freelancers and agencies. When proposing a marketing strategy, abstract concepts like "SEO growth" or "brand awareness" often fail to land. A layered pyramid infographic template provides a concrete metaphor for these services. Because the vector files maintain crisp edges at any resolution, you can embed these graphics into a PDF proposal or display them on a 4K conference screen without pixelation. The ability to edit text directly ensures that the terminology matches the client’s specific industry jargon, which builds trust and demonstrates attention to detail.
Educational and Training Scenarios
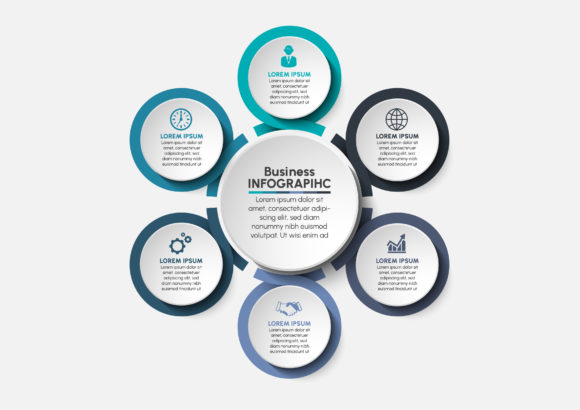
Educators and corporate trainers face the unique challenge of making dry material memorable. A presentation infographic template transforms a lecture on historical events or safety protocols into a visual story. For example, a history teacher might use a horizontal timeline template to show the cause-and-effect relationship between political treaties, while a safety officer could use a circular process diagram to explain emergency evacuation routes.
In these settings, the format flexibility is crucial. An educator might need to print the infographic as a handout or poster. The Vector EPS10 file with text converted to outlines guarantees that the design prints correctly even if the school’s computer lacks the specific fonts used in the original design. Conversely, a digital course creator might prefer the JPG preview for quick insertion into a Learning Management System (LMS) before deciding to customize the full vector version for a premium downloadable resource. This adaptability supports both synchronous classroom teaching and asynchronous online learning.
Content Creation and Digital Marketing
For bloggers, social media managers, and influencers, content velocity matters. Creating custom data visualization from zero is time-prohibitive when posting daily. A presentation infographic template acts as a consistent branding anchor. By establishing a color palette and typography style within the AI or PSD file, creators can produce a series of cohesive carousels for Instagram or LinkedIn that reinforce brand recognition.
Consider a personal finance blogger explaining compound interest. A static bar chart is functional, but a styled infographic template that uses icons and color gradients makes the concept shareable. The "shareability" factor is a direct outcome of good template design; users are more likely to save or repost content that looks professionally curated. Furthermore, having the source vector file means the creator can easily resize the artwork from a landscape blog header to a vertical Pinterest pin without losing quality or rearranging elements manually.
Understanding File Formats and Workflow Integration
To get real value from this asset, users must understand how the included file types serve different stages of production. The Vector AI CS3 file with editable text is the master document. It offers maximum flexibility for changing colors, moving nodes, and rewriting copy. However, it requires Adobe Illustrator or compatible vector software. If you do not have access to vector tools, the Photoshop PSD file with editable text becomes your primary workspace. While raster-based, smart objects and text layers allow for significant customization without needing to draw paths.
The Vector EPS10 file with text converted to outlines serves a specific archival and production purpose. Because the text is no longer editable but is instead rendered as shapes, this file eliminates font compatibility issues. It is ideal for sending to third-party printers or sharing with collaborators who might not have your font library. Finally, the JPG Preview image is not just a thumbnail; it is a reference guide. Before opening heavy software applications, you can verify that the template contains the specific layout structure you need, saving time during the selection process.
Strategic Considerations Before Implementation
Before integrating a presentation infographic template into your workflow, assess the alignment between the template’s structure and your data. A common mistake is forcing quantitative data into a qualitative layout, such as trying to fit precise financial tables into a conceptual mind map. Choose a template based on the story you need to tell, not just its aesthetic appeal. If your goal is comparison, look for split-screen or versus layouts. If your goal is progression, prioritize linear or cyclical designs.
You should also evaluate the editing complexity relative to your skill level. Some templates utilize advanced clipping masks and blending modes that look stunning but are difficult to modify for beginners. Inspect the layer organization in the PSD or AI file description. Well-organized, named layers indicate a user-centric design that will save hours of frustration. Additionally, check the license terms carefully. While many templates allow for commercial use in client work, some restrict resale or redistribution of the modified template itself. Understanding these boundaries prevents legal complications down the line.
Customization as a Value Multiplier
The true ROI of a presentation infographic template comes from customization. Using a template "as is" often results in generic-looking content that audiences have seen before. To avoid this, treat the template as a starting point rather than a final product. Change the iconography to match your specific niche; replace generic silhouettes with photos of your actual team or products. Adjust the white space to accommodate longer explanations if your audience requires more context.
For small business owners, this level of customization bridges the gap between DIY and agency-quality design. Instead of paying hundreds of dollars for a one-off graphic, you invest once in a template system and amortize that cost across dozens of presentations, reports, and marketing assets. The editable nature of the text and vectors means the asset grows with your business. A startup might use the same template framework for their seed pitch deck and later adapt it for their Series A investor update, maintaining visual continuity that signals stability and professionalism.
Making Data Accessible Across Platforms
Modern communication happens across fragmented platforms. Your infographic needs to survive the transition from a projector screen to a mobile phone. When working with the vector files, consider creating multiple artboards within the same document. Design a detailed version for desktop viewing and a simplified, high-contrast version for mobile users. The scalability of the AI and EPS formats makes this multi-output workflow seamless.
Accessibility should also inform your use of these templates. Ensure that color contrast ratios meet readability standards, especially when modifying the default palette. Since the text is editable, you have the opportunity to choose inclusive fonts and adjust sizing for legibility. Alt-text descriptions for the JPG previews and embedded graphics further extend the reach of your content to visually impaired audiences. By leveraging the technical flexibility of the provided files, you ensure that your visual communication is effective, ethical, and far-reaching.