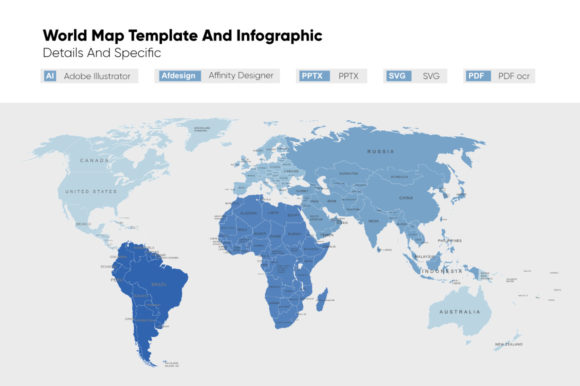
World Map Template and Infographic for Designers
Creating accurate, visually appealing geographical visuals is one of the most time-consuming tasks in graphic design and presentation planning. Whether you are building a corporate pitch deck, designing an educational handout, or creating a complex data visualization, sourcing a reliable World Map Template and Infographic can significantly streamline your workflow. This resource is specifically engineered for designers, agencies, and content creators who require professional-grade vector assets without the hassle of tracing low-resolution images or licensing expensive proprietary software plugins.
The core value of this collection lies in its technical precision and versatility. Unlike generic raster images found through standard search engines, these files are true vectors provided in SVG format alongside high-resolution PDF OCR options. This distinction matters because it allows for infinite scalability without pixelation, ensuring that your map looks crisp on a 4K presentation screen or a large-format printed poster. With six distinct stylistic variations and continent-specific divisions included, the template serves as a foundational asset library rather than a single-use graphic.
Streamlining Vector Editing in Professional Software
For professionals working within Adobe Illustrator or Affinity Designer, organization is just as important as the visual output. A common frustration with downloaded map assets is poor file hygiene; paths are often ungrouped, layers are unnamed, and countries are merged into single compound shapes that are nearly impossible to isolate. This World Map Template and Infographic addresses those pain points directly through meticulous file structuring.
Every country in the Adobe Illustrator files is grouped individually and resides on a layer explicitly named for that region. This level of organization transforms what should be a tedious editing task into a seamless process. If you need to highlight specific markets in Southeast Asia for a client report, you can simply locate the named layers, apply your brand colors, and hide the rest without risking accidental edits to neighboring regions. This structural integrity supports rapid iteration, allowing designers to test multiple color schemes or regional focuses in minutes rather than hours. For agencies handling multiple international clients, this efficiency compounds over time, reducing billable hours spent on file preparation and increasing time available for strategic creative work.
Cross-Platform Compatibility for Diverse Workflows
Modern design teams rarely operate within a single software ecosystem. A significant advantage of this template package is its genuine cross-platform utility. While the primary source files are optimized for Adobe Illustrator, the inclusion of editable SVG files ensures compatibility with Affinity Designer and Microsoft PowerPoint. This flexibility is crucial for collaborative environments where a designer might create the initial asset in Illustrator, but a marketing manager needs to make minor text or color adjustments later in PowerPoint.
The PowerPoint compatibility is particularly valuable for non-designers. Because the maps are imported as editable vector shapes rather than static images, stakeholders can update data visualizations independently without breaking the design or requiring a designer’s intervention. This democratizes the design process while maintaining professional standards. However, users should note that while SVGs transfer well between platforms, complex gradients or specific effects created in Illustrator may render differently in PowerPoint. It is always best practice to test the asset in your target delivery platform before finalizing a project to ensure visual consistency.
Optimizing Resolution for Print and Digital Delivery
One of the most frequent failures in geographical design is resolution mismatch. A map that looks acceptable on a laptop screen often becomes blurry when projected or printed. This template eliminates that risk by providing assets at 1080x1980 resolution and 300 DPI. This specification covers the vast majority of use cases, from social media infographics to high-quality brochure printing.
For print designers, the 300 DPI standard ensures that fine details, such as border lines and small island nations, remain sharp and legible. The PDF OCR option adds another layer of utility for archival or documentation purposes, making the map searchable and accessible. In digital contexts, the 1080x1980 aspect ratio is optimized for modern mobile-first storytelling and vertical video backgrounds, though the vector nature of the SVG means you can easily resize the artboard for traditional 16:9 presentations without losing quality. This dual-purpose readiness makes the World Map Template and Infographic a practical investment for creators who repurpose content across multiple channels.
Six Stylistic Variations for Contextual Relevance
Geographical data requires different visual treatments depending on the message. A geopolitical analysis demands clean, distinct borders, while a travel blog might benefit from a more stylized, artistic interpretation. Including six different styles within this template acknowledges that one aesthetic does not fit every project. This variety prevents the "stock photo" look that can make presentations feel generic.
Designers can select a minimalist outline for data-heavy dashboards where the map serves as a subtle background anchor, or choose a bold, filled style for infographics where geography is the primary focal point. The continent-divided options further enhance this utility, allowing for modular layouts where only relevant regions are displayed. This reduces visual clutter and helps guide the viewer’s attention to the specific area of interest. When selecting a style, consider the density of your data; highly detailed information overlays pair better with simpler map styles, whereas sparse data can handle more decorative cartography.
Practical Applications and User Considerations
While this World Map Template and Infographic is a robust tool, understanding its ideal applications helps maximize return on investment. Marketing agencies will find the most value in the combination of editable layers and PowerPoint compatibility, enabling fast turnaround times for client pitches. Educators and academic publishers benefit from the accuracy and print-ready resolution for textbooks and classroom materials. Freelance designers appreciate having a reliable, pre-organized asset that removes the uncertainty of free downloads.
However, potential users should assess their specific needs against the template's features. If your work requires real-time GIS data integration or highly specialized topographical details, this template is designed for presentation and infographic aesthetics rather than scientific cartography. Similarly, while the files are editable in PowerPoint, advanced path manipulation is still best performed in dedicated vector software like Illustrator or Affinity Designer. Users relying solely on PowerPoint should stick to color changes and simple scaling to maintain file integrity.
Ultimately, the decision to use this template should be based on the balance between customization needs and time savings. For projects requiring bespoke, hand-drawn cartography, this may not be the right fit. But for the vast majority of business, educational, and creative communication tasks involving world geography, it provides a professional foundation that respects both the designer's time and the audience's need for clarity. By solving the technical friction associated with map creation, it allows creators to focus on the narrative and data insights that truly matter.
- Verify Layer Structure: Before starting a large project, open the AI file and confirm that the grouping logic matches your workflow preferences.
- Test Export Settings: When exporting SVGs for web use, ensure you optimize the file size to prevent slow loading times on interactive dashboards.
- Check Regional Accuracy: While templates are generally accurate, always verify specific border representations against current geopolitical standards relevant to your audience.
- Maintain Aspect Ratio: When resizing in PowerPoint, hold the shift key to prevent distortion of landmasses, which can undermine credibility.